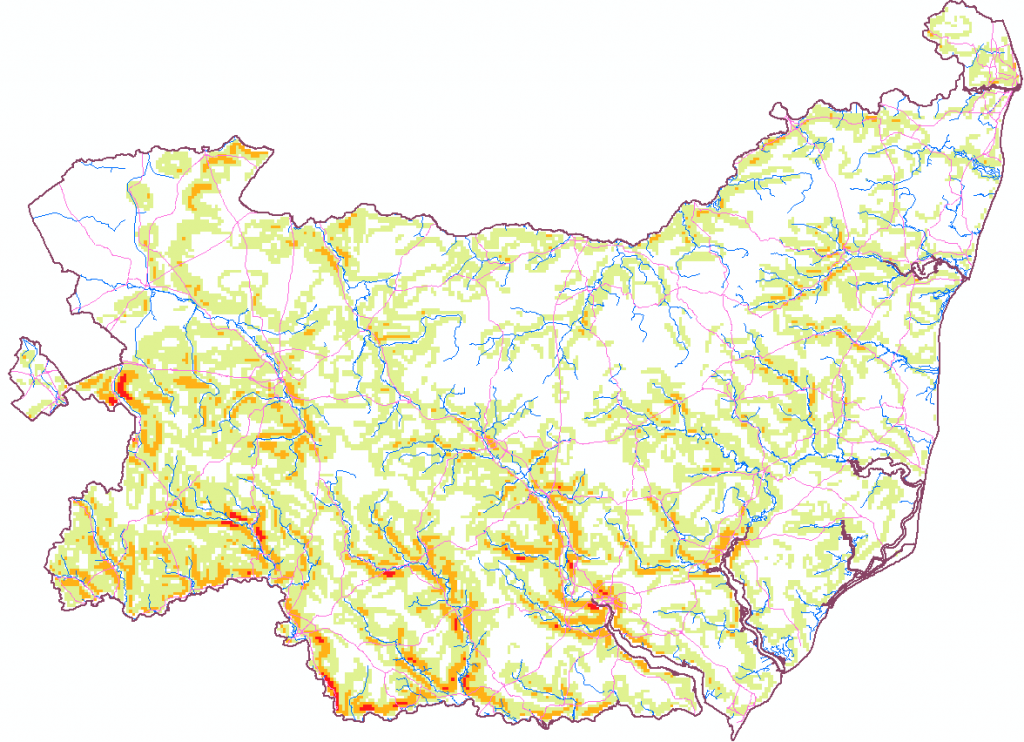
Slope map – Road biking
The map shows the location of the best road stretches in the county for road biking climbing training, those with averaged gradient between 4% and 5.5% over 280 meters -which is the pixel resolution- or longer. Most of them are near the left bank of Stour river, along the border with Essex, and its tributary Glenn. Note that most of the county is flat or nearly flat (slope less than 1%, represented by white color). In the map, main roads are colored pink and main rivers blue.
Physical map – Follow the valleys
Where are the main rivers and valleys? What is the highest point in the county? This maps shows you all that and more, like the major urban areas and the lower than 0-meter areas. Yes, part of the county is below sea level, with a lowest elevation of -1.68 m! On the other hand, the highest location rises to nearly 129 m.
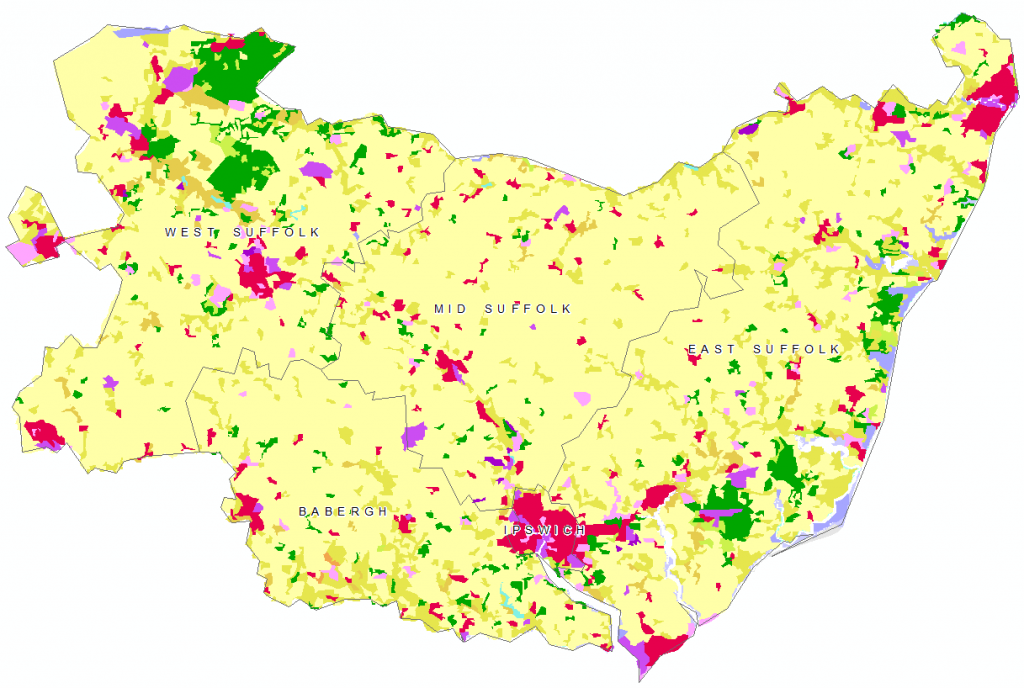
Land cover – CORINE 2018
This map shows land cover categories in Suffolk by European Environmental Agency’s CORINE 2018 survey, at a 100 meters per pixel resolution. The 15 classes represented are Level 2 in the hierarchy (i.e. 1.1, 1.2, etc.). Nearly three-quarters of the county is devoted to non-irrigated arable land, followed by pastures and other agricultural areas (13%), and man-made artificial areas (8%). Forests, shrub and srub areas only represent 6% of the land, whereas wet areas and other water bodies less than 1%.
Employment Map – Job Density
Where are the jobs in Suffolk? This map shows the number of jobs per resident aged 16-64 and per district in 2018. The total number of jobs is a workplace-measure and comprises employees, self-employed, government-supported trainees and HM Forces. Major urban areas are also displayed as proportional squares representing population as of Census 2011.
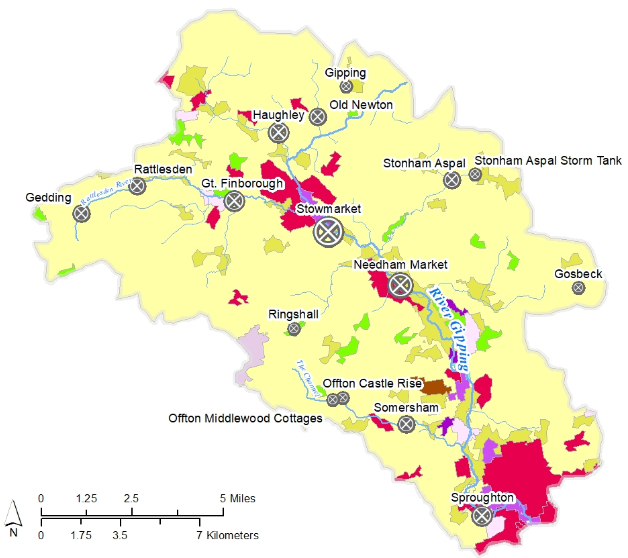
Gipping River Watershed – Consented Nitrate Discharges
This map shows consented nitrate discharges (kg per year) just for Water Company Sewage Disposal Works in the River Gipping watershed (Mid-Suffolk district). Amounts are represented by proportional symbols. Most of the consented discharges are associated to the final effluents of major urban areas. Additionally, the map background shows main land cover categories according to CORINE 2018, where it is clearly obvious that most of the watershed consists of arable land (another source of contamination. Check more on pollution and the river Gippine here: https://arcg.is/1X4WTP)
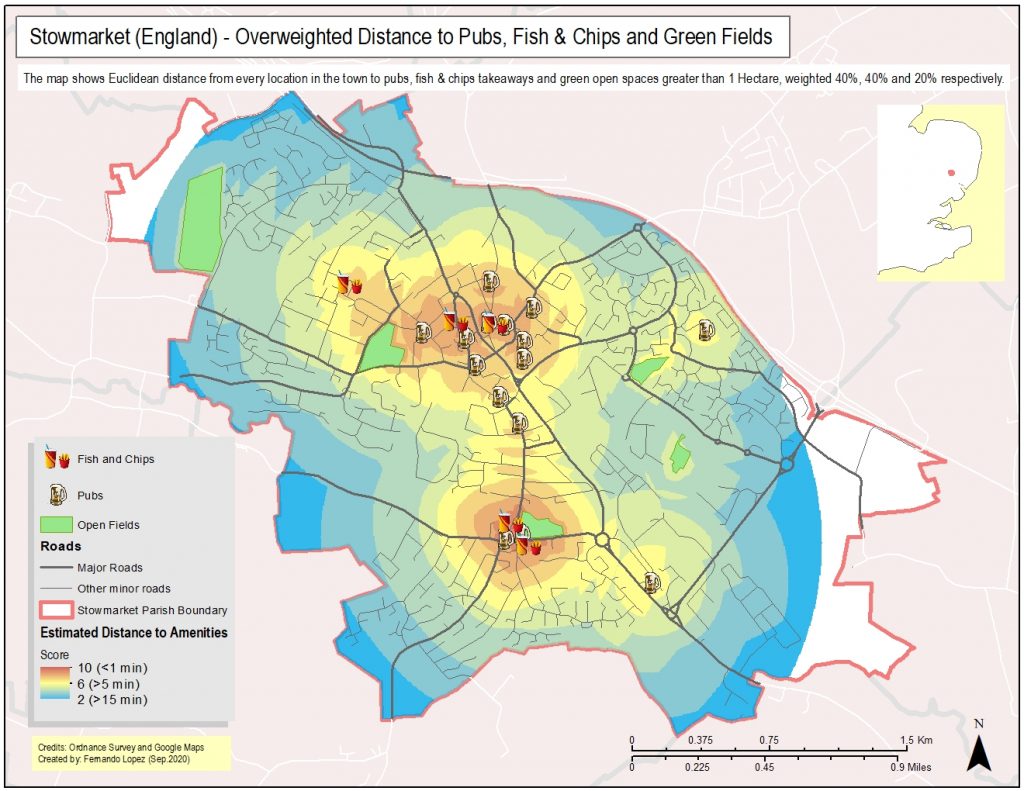
Stowmarket – Follow the chippies
What are the nearest properties to fish & chips and pubs in Stowmarket? What if we considered green fields as well? This map shows walking distance time when chippies, pubs and greens are weighted 40%, 40% and 20% respectively. Closest locations are hottest (red and a score of 10), whereas farthest are coldest (blue and minimum score). Enjoy your meal!
Petanque Pistes – Prendre une Fanny!
The map shows the location of known petanque pistes in Suffolk (you may want to send me an email if you’re missing one you know!). Some are in public spaces, whereas others are in private premises (mostly pubs and inns). Addresses are provided by clicking on the symbols. In orange, the Meadlands Eagles HQ, based in Stowmarket. Profitez-vous! (https://arcg.is/09uujm)