GIS Specialization – Final Assignment 4
University of California, Davies (Coursera)
Background
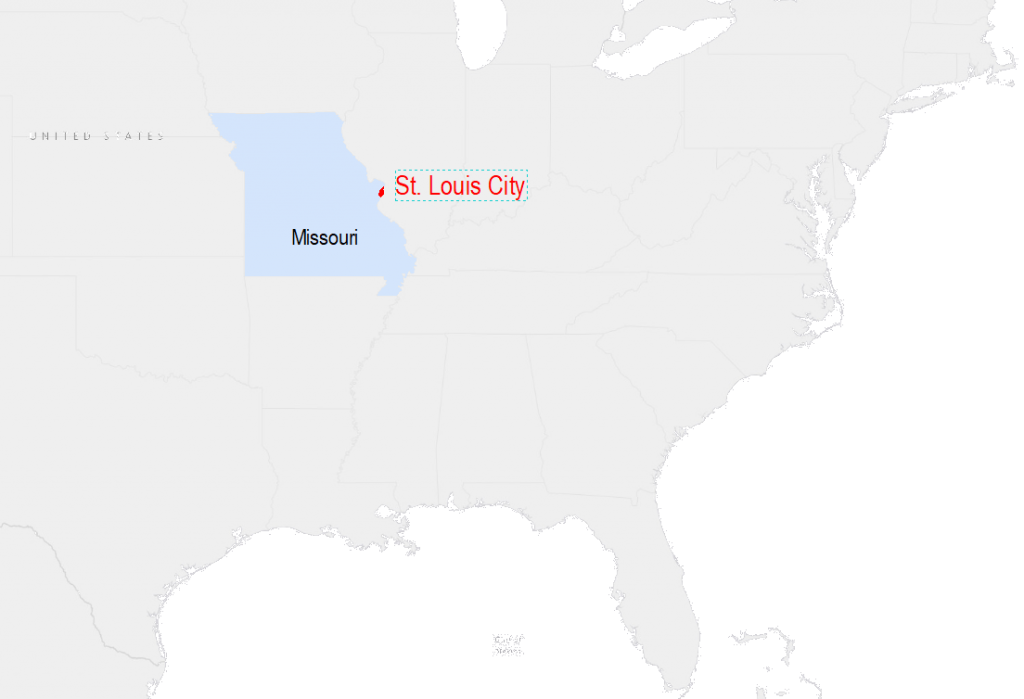
This open-ended final assignment for the Imagery, Automation, and Application course was carried out over two weeks in Feb 2020. Pretending to be a satellite imagery analyst working for the United Nations, I conducted this project to evaluate the extent of flooding of the Mississippi river across St. Louis City (Missouri, United States) in May 2019 -an event that made NASA’s EO Image of the Day in May 10, 2019, see link below-, and particularly to test the following hypothesis: the flooded area in neighborhoods along the riverbank was larger than that of just St. Louis Downtown, which also sits by the river.
1. Image Acquisition & Processing
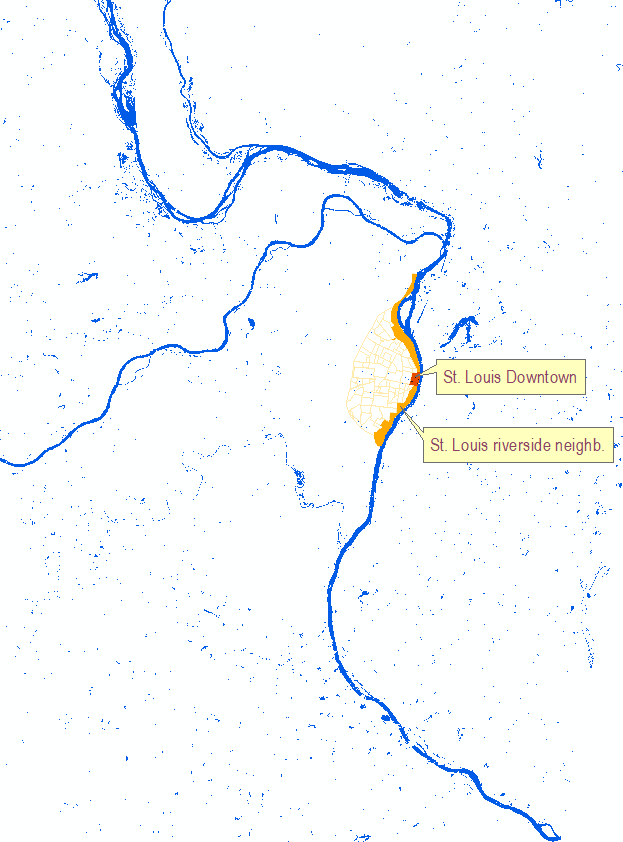
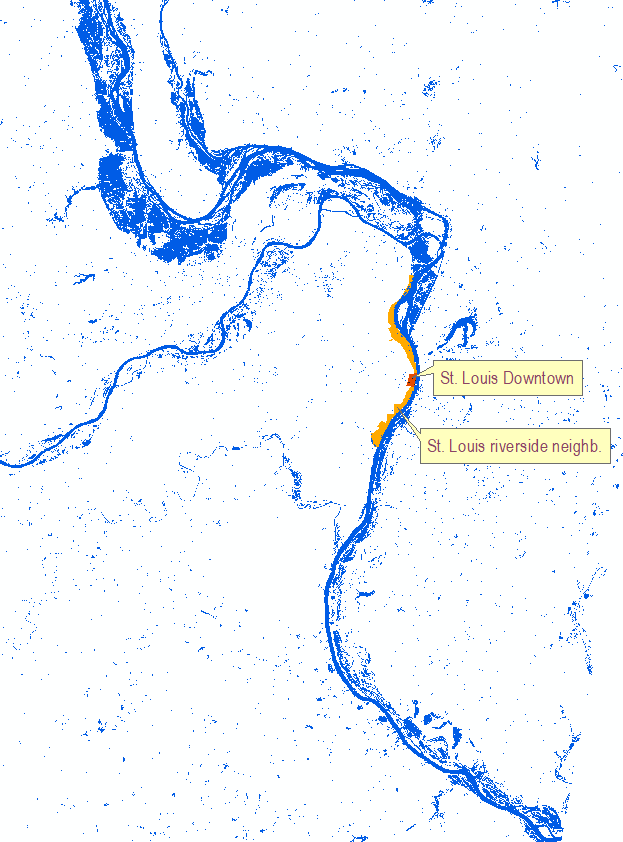
Two Landsat 8 Collection 1 (C1) Analysis Ready Data (ARD) Surface Reflectance (SR) images at 30-meter resolution of the study area were obtained: one with the flooding and one with normal river extent for comparison. While I chose May 7 for the flooding image, I searched for a comparison image as close in time as the flooding event: mid-autumn, after the summer drought and when some rain is supposed to have already fallen, seemed a good choice -the Oct 11, 2018 image was finally selected as was devoid of clouds-. Landsat 8 images come with 7 bands. In this project, I used band 2 (blue), band 5 (NIR) and band 6 (SWIR1) for red, green and blue filters respectively.
A shapefile with St. Louis City neighborhoods was obtained from the St. Louis Government site. The riverside neighborhoods were extracted and dissolved nto one layer, whereas the downtown neighborhood was extracted to a different layer. Thus, the total surface in square meters for both areas is obtained.
Coordinate system used throughout was WGS 1984 Albers.
2. Image Analysis
For each image, I first created 40 training polygons for classification clustered into 4 categories: Water, Vegetation, Agriculture and Urban Areas. A Maximum Likelihood Supervised Classification was then ran for every image and the Water category extracted into two different rasters.
The layer of riverside neighborhoods and the layer of St. Louis dowtown were passed in turn along with the previous two water extent rasters to a custom-built algorithm (model) to calculate flooding extension in a given polygon area. Their outputs presented as 30-m rasters as well.
At a glance, the model calculates the difference between the two water rasters and the ovelapping with the given features, before working out the area in square meters depending on the pixel resolution input parameter.
3. Results & Mapping
Once the flooded surfaces have been estimated, I could plug in all values into the tested formula as shown below, yielding a slightly larger area of downtown flooding: 3.66% vs 3.23%, therefore invalidating my initial hypothesis.
This was however a rough estimate. There are numerous ways of improving the accuracy of results, from using higher-resolution images for classification to using the NDWI interpretation or even a DEM to account for slope and aspect.
Sources
Landsat 8, St. Louis Government (Missouri, US). Retrieval date: February 2020