The Analysis
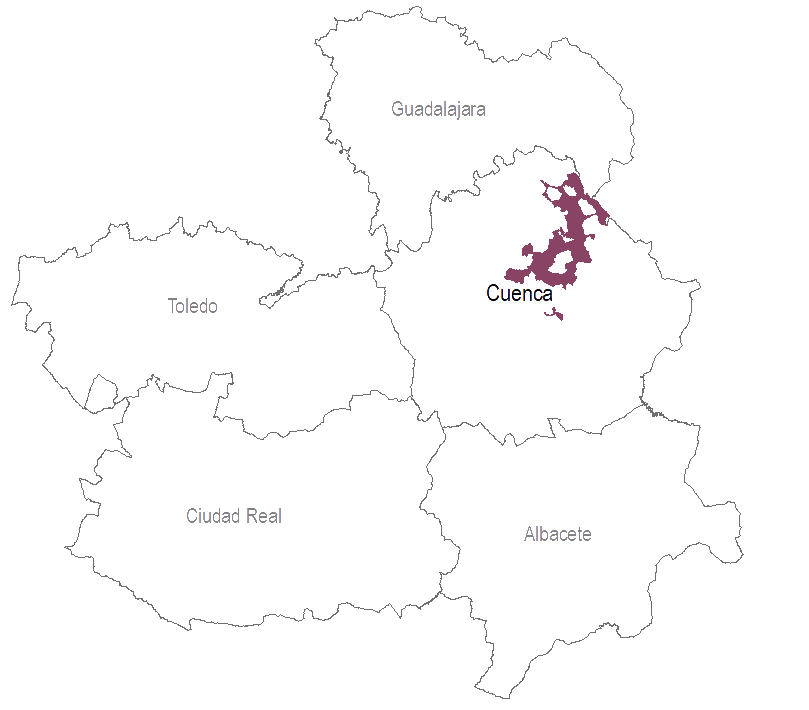
The five CORINE data series have been analysed in the following maps and graphs: 1990, 2000, 2006, 2012 and 2018. Not only the cover status for every year, but also the changes occurred between any two surveys. Data was retrieved in March 2020.
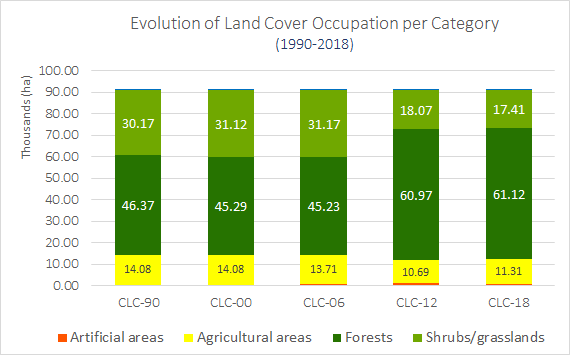
In the analysis for the study area, CORINE classes 311, 312 and 313 were dissolved into a more general Forests category, whereas 321, 323 and 324 are grouped into shrubs/grasslands. All level 1 1xx codes were grouped into Artificial areas, and all level 1 2xx codes did so into Agricultural areas. Sparsely vegetated areas (codes 33x) and Water bodies (codes 5xx) extent not visible on the chart’s scale, so they are removed from the legend.
Between any two surveys, CORINE tracks too effective changes in land cover with a MMU of 5 hectares. Thus, the resulting change layers can be processed to work out statistics and to shed light onto land cover drivers.
Because any land plot might change from one class to another, which would end up in numerous combinations, the EEA created 9 so-called Level 1 Land Cover Flows for meaningful assessment (check https://www.eea.europa.eu/data-and-maps/dashboards/land-cover-and-change-statistics), such as LCF1 Urban Land Management or LCF7 Forest Creation and Management.
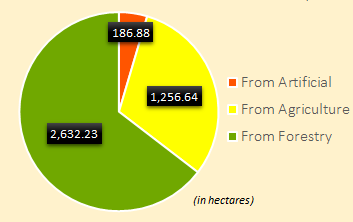
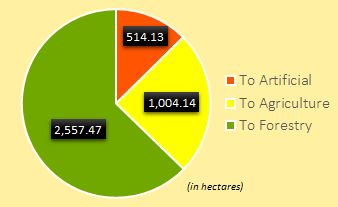
Additionally, the flows can be viewed from both the perspective of decreasing land cover and the perspective of creation of land cover, being called consumption and formation respectively. In my analysis, I further grouped the relevant LCFs into 3 major categories to get the big picture, which can be seen on the attached pie charts.
Sources
EEA CORINE website, Instituto Geográfico Nacional (Spain). Retrieval date: March 2020